The Ultimate Business Intelligence Reporting Cheat Sheet
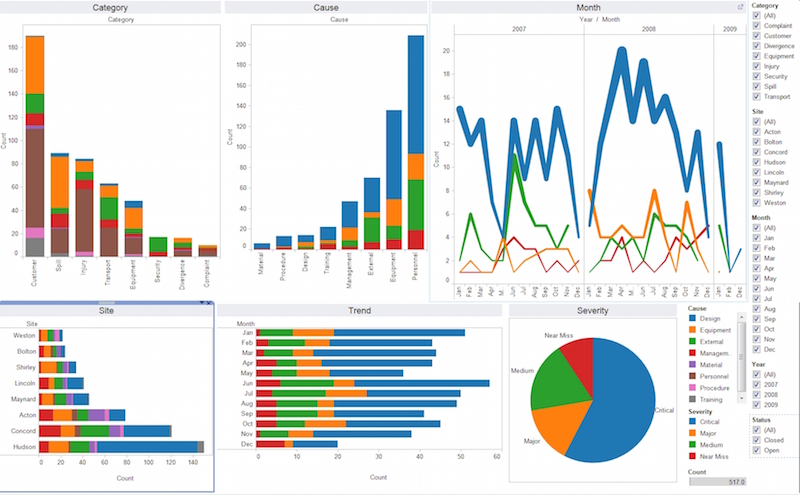
Business Intelligence (BI) is a broad field that involves collecting, processing, and analyzing large amounts of data to make more informed, and ultimately, more profitable decisions. Business Intelligence reporting is the most crucial and most apparent part of BI. It is the process of viewing this vast amount of data in a way that can be easily understood and often enables viewers to ask various questions of the dataset without needing to be a developer or database administrator.

This Business Intelligence reporting cheat sheet will discuss basic terms that are needed to understand and explore the world of BI. It will also introduce several popular BI reporting tools and technologies. Follow along and take your first steps into the exciting and flourishing world of business intelligence.
Business Intelligence Terms
- Ad Hoc Query (Ad Hoc Reporting) – Ad Hoc Queries are like spur of the moment questions asked of the dataset. If you have seen a reporting system where you can only change 1 filter (maybe a start & end date), it is likely not Ad Hoc. Instead Ad Hoc reporting tools allow users to filter on & display the data in almost any way desired. These reports are often one-off and exploratory, rather than the type of report ran every day or week.
- Canned Reports – Canned reports are the type of reports that are run at a regular interval. They often have a few filter options, but basically answer the same question each time they are run. Examples of this would be a weekly sales report.
- Cube – A cube (or “datacube”) is a way of storing multidimensional data. Traditional databases consist of tables made up of rows and columns, which effectively makes them 2-dimensional. Cubes are 3-dimensional and are often a better form of storage for real-world business data that is being considered for Business Intelligence reporting. These cubes are either made in real-time or are recreated at regular intervals.
- Data Mining – Data mining is a process by which large datasets are explored. The goal of this process is often to find correlation and causation between various variables in a system. This is beneficial when attempting to better understand what makes a market, product, or company successful from an analytical perspective.
- Data Warehouse – Data warehouses are the repository in which the dataset used for BI reporting is held. It is usually made up of cubes and tables.
- Dimension – Dimensions are structures within cubes that represent elements in the system. They enable users to filter, group, and label the data they are analyzing.
- Drill Down – Drilling down is the process used to further distinguish a data set. For example, if you are looking at a company-wide sales report for a week and you click on a single day, a new report breaking that day’s sales up by hours might appear. Going from a higher-level view to a lower-level view of a dataset is drilling down into the data.
- ETL – ETL stands for “extract, transform, and load.” It is a process used in many datasets where data is pulled from various systems into a new data warehouse. It pulls down the new data, rearranges or alters the data to fit its new home, and then inserts it amongst the existing data.
- KPI – KPI stands for key performance indicator. A KPI is something that plays a major factor in a company’s success. It is often found through data mining and Business Intelligence reporting efforts.
- ODBC – Open Database Connectivity (ODBC) is a standard that is meant to make accessing database management systems system-agnostic. This means something written to ODBC standards should be portable to another system and require minimal changes to accommodate the new system.
- OLAP – OLAP is yet another acronym. This one stands for online analytical processing. It is basically a technique used to perform business intelligence reporting with computers and computer applications that help display and analyze data.
- Pivot – Pivoting is a technique used to quickly view data in a new way. It is often used in spreadsheet or database programs to summarize or combine large amounts of data.
- SQL - SQL stands for standardized query language. It is the way programmers, DBAs, and technical users often interact with databases. Most database implementations support SQL querying of the stored data. Common SQL commands are things like Select, Insert, Update, Delete, and Order By.
Popular BI Development Tools
- BIDS – Business Intelligence Development Studio (BIDS) is a Microsoft product that takes Visual Studio (a development tool) and tweaks it to work directly with Microsoft SQL Server for Business Intelligence reporting purposes. It is one of the mostly widely used BI systems.
- R - R is a scripting language used by the vast majority of statistical programmers. Most BI tools utilize code that is written in R. Often extending or altering a BI program’s functionality will require writing custom R code. R is one of the primary languages used for data mining.
Popular BI End-User (Front-end) Tools
There are hundreds of BI tools today. Deciding which is right for you comes down to price, functionality, form, and licensing requirements. Some of the most popular applications today are SAP Business Intelligence, Pentaho BI, Microstrategy, Qlikview, Microsoft Sharepoint, and Tableu.
Conclusion
If you are beginning your journey into the world of BI reporting, I would look to find a free demo version of one of the above applications and try it out for yourself. There are countless free and easily available datasets that are perfect for business intelligence reporting. One of the most important things to remember is that the tools can change frequently, but the concepts change slowly and are replaced infrequently. So, rather than mastering a single tool, I would definitely recommend mastering the field itself. Once you do that, learning a new tool is just a matter of relearning hotkeys, memorizing new menu options, and learning a few new terms.


