BHW Group Blog
Business Intelligence with NodeJS, CouchDB, and MapReduce
Submitted by Brett Burnett on Monday, 09/08/14
NodeJS, CouchDB, and MapReduce Overview
When starting a Business Intelligence (BI) project the first challenge technical teams face is often the most difficult, "how do we shape our data to meet our needs?". Why is this difficult? Consider the following example.
Today everyone is familiar with online banking. Most banks provide monthly budget reports illustrating how much money was spent in specific expense categories (clothing, groceries, home improvement, dining, etc.). It's reassuring to believe that my bank reviews each and every one of my receipts so that the next time I shop at a big-box store they're ready to tell me how much of my money went toward these categories. Except they don't. Banks only record the information you see in online banking, and suspiciously there's no line item detail. Banks summarize, assuming that every dollar I spent on my last shopping excursion was simply spent on "home supplies" (at least until Level 3 credit card processing with Line Item Detail is supported by retailers). But wait, I'm a savvy consumer and I scan all my receipts and digitize them before they are recycled. I'll just go back and inspect them to see what I purchased. I'm feeling pretty good about myself until I stop to think, "HOW much money did I spend on ELECTRONICS in the last THREE MONTHS?" My savvy system was great at recording how much I spent and where, but answering this question will be a slow and tedious exercise of frustration.
Almost all data originates in some form of an online transactional processing (OLTP) system. OLTP data is organized for real-time performance, security, auditing, and application specific concerns such as non-repudiation. To answer anything but the simplest questions, OLTP data must be rolled up, grouped, filtered, and aggregated. To answer my question I need to group all the line items from my receipts, filter them for transactions in the last three months, then aggregate them by summing the cost of each item. Clearly, there has to be a better way! So rather than staring at receipts for the next few hours, I decided to write this blog article to justify how long my account exercise is taking...
Shaping Data for Business Intelligence
Enter the ETL project. ETL stands for extract transform and load. These solutions are responsible for gathering, massaging, and storing data in the shape we need for analysis in a data warehouse. Historically ETL was expected to move data from transactional systems into online analytical processing (OLAP) systems. ETL and OLAP systems are generally expensive software products with annual licensing, exotic high-end hardware, and require frequent care and feeding. But then, Google changed everything when they released a white paper describing their approach to distributed analysis of search terms using an algorithm tailored for parallel processing called "MapReduce". Open source developers quickly converged on similar solutions, the most popular of which is Apache Hadoop. With these projects, companies can use commoditized, inexpensive hardware, scaled out over many nodes to perform the same work as a Data Warehouse but faster and for a fraction of the cost. We'll have an exciting blog article on Hadoop and Apache Hive out soon, but until then let's do a small example showing MapReduce at work.
Our Datasource

For our example I decided to do something much easier than analyzing my receipts. I decided to analyze the 2014 World Cup results and determine how accurately you could predict the winner by looking simply at summary information from each game. First I had to find a datasource, which surprisingly wasn't easy to do. After some searching the best option I found was football.db, an excellent resource for many matches, including the World Cup. Once I started working with the data, the first challenge was that football.db is formatted as human-readable text. It reads like a tweet a fan would post about the match result rather than a machine-readable electronic record.
Jun/8 2012      United States           3-1 Antigua and Barbuda   @ Tampa
Jun/8 2012      Jamaica       2-1 Guatemala             @ Kingston
NodeJS Formatting
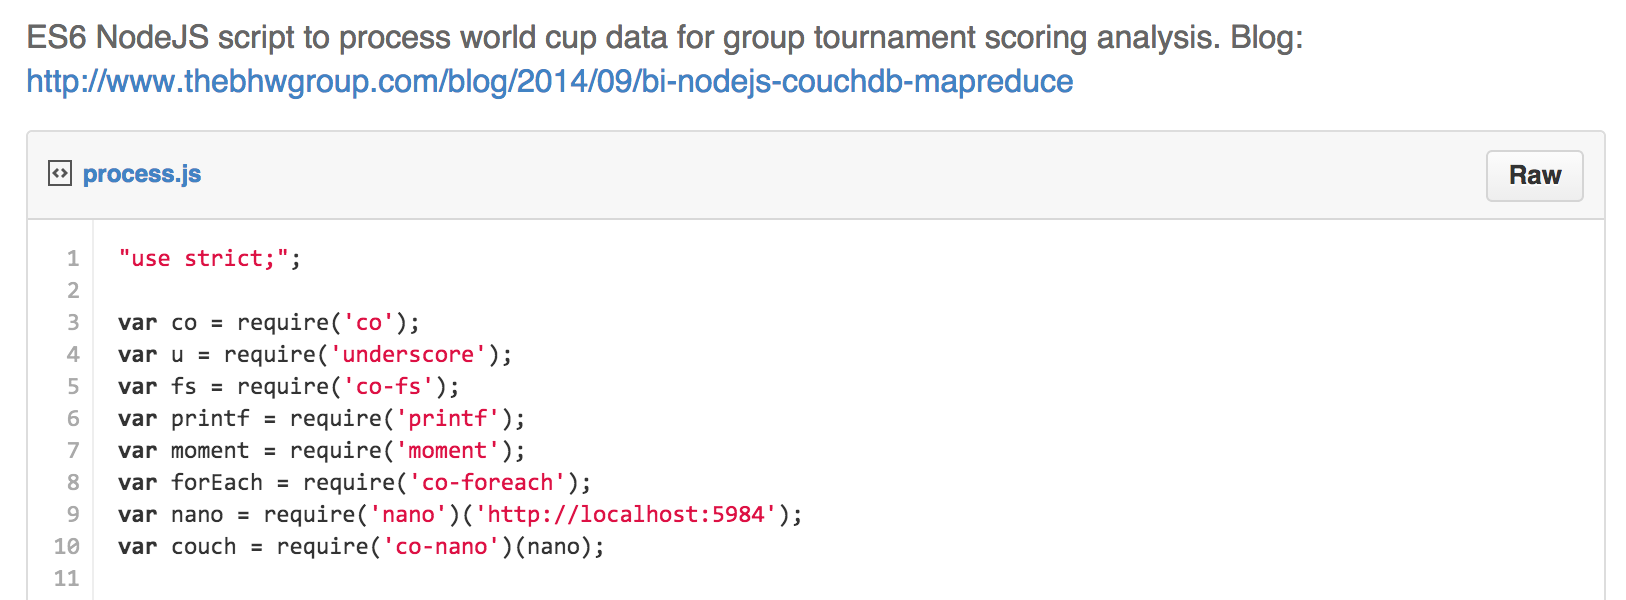
This kind of processing is typically a hard problem for ETL and database tools. I needed to parse unstructured data into a structured format for analysis. I decided to write a small NodeJS script using regular expressions to parse the football.db scores. I already knew that I wanted to store my results in CouchDB for display in a Single Page Application. The choice of NodeJS was easy because as a JavaScript engine it serializes objects directly into CouchDB's expected JSON document format. I also wanted to work with a new language feature coming out in ES6 called generators. While not yet in the official NodeJS build, generators are available in --harmony mode using the latest bits.
This gist contains my final NodeJS script.
Running the script with NodeJS will produce an array of team results like:
{
    team: 'Germany',
    goals_for: 50,
    goals_against: 14,
    win: 13,
    loss: 0,
    draw: 2,
    points: 79,
    goal_diff: 36,
    games: 15,
    finish: 'Finals'
}
See this gist for the complete results.
MapReduce
If you look at the original data you'll notice that games are recorded as one entry, displaying both the home and away team's scores as one record. This immediately caused a problem for me. In order to determine a team's total goals I had to look for the team in both situations, home and away. I need to combine the results of both. This is where Map in MapReduce comes into play. By using Map I am able to convert the single game record into two distinct team records, with each team record listing the goals for, goals against, win, loss, etc. After the Map I now have a more uniform datasource to continue my analysis. Reduce is now used to gather all my team entries and sum them so that I have totals per team. In a system like Apache Hadoop I could pass large amounts of data through this step, but in our example the datasource is reasonably small so NodeJS with help from underscoreJS is all I need to demonstrate MapReduce in action. Here's an example of our Map statement from our NodeJS script.
Map
Notice how the same structure is produced for both a home or away team from a single game record. This allows both teams to be treated the same for analysis.
var team_result = u.map(result, function(game){
    if( game.home === team ){
        return {
            team: team,
            goals_for: game.home_score,
            goals_against: game.away_score,
            win: game.home_score > game.away_score,
            loss: game.away_score > game.home_score,
            draw: game.home_score === game.away_score,
            finish: game.finish
        };
    } else if( game.away === team){
        return {
            team: team,
            goals_for: game.away_score,
            goals_against: game.home_score,
            win: game.home_score < game.away_score,
            loss: game.away_score < game.home_score,
            draw: game.home_score === game.away_score,
            finish: game.finish
        };
    } else {
        return null;
    }
});
Reduce
In our Reduce step, we need to gather all our team entries and aggregate them for analysis. Below you'll see that we create sums for the goals scored, goals allowed, etc. We also perform a more complex expression to calculate the team's points from the match, based on a 3-1-0 group tournament ranking system. Finally we record the team's finish in the tournament to represent how deep into the event the team managed to go.
var team_final = u.reduce(team_result, function(memo, res){
    if( res === null ){
        return memo;
    } else {
        memo.goals_for += res.goals_for || 0;
        memo.goals_against += res.goals_against || 0;
        memo.win += res.win === true ? 1 : 0;
        memo.loss += res.loss === true ? 1 : 0;
        memo.draw += res.draw === true ? 1 : 0;
        memo.points += Math.min(3, res.goals_for || 0) + (res.win === true ? 1 : 0 ) * 3 + (res.draw === true ? 1 : 0 );
        memo.goal_diff += (res.goals_for || 0) - (res.goals_against || 0 );
        memo.games += 1;
        memo.finish = Math.max(memo.finish, res.finish);

        return memo;
    }
}, state);
CouchDB
CouchDB is a popular NoSQL document store that utilizes JSON formatted documents. NoSQL has become mainstream with MongoDB, one of the best known NoSQL stores, now occupying the rank of fifth-most used database system in the world. CouchDB makes some different architecture choices from MongoDB and is gaining adoption. We selected CouchDB for this project because the data we store will seldom change and we wanted to use CouchDB's MapReduce capabilities in our Single Page Application article about Clojure. One of the best features of JSON based document stores like CouchDB is how easy they are to work with from NodeJS. Below you'll see just how easy it is to write our calculated team result to CouchDB:
//record our results in CouchDB
var db = couch.use('world_cup_2014');

forEach( final_results, function* (fres){
    var x = yield db.insert(fres, fres.team);
}).then(function(){
    console.log('success');
}, function(err){
    console.log(err);
});
CouchDB offers MapReduce as a core feature, and CouchDB's excellent web-based management tool, Futon, allows developers to write JavaScript based MapReduce statements in a test environment. The code we wrote above could easily be written into CouchDB as a stored view and used by our application, just like calling a procedure in an RDBMS system.
In our example we performed MapReduce from NodeJS, but in a real-world system we would have stored the data in a more granular structure and used CouchDB's MapReduce to calculate our results. If our dataset was larger we would use CouchDB for MapReduce since we could deploy CouchDB across multiple server nodes and leverage the true power of MapReduce - scaling for performance.
Conclusion
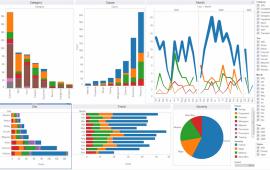
This was a great project to demonstrate many exciting open source technology options for facilitating Business Intelligence with unstructured data. NodeJS, CouchDB, and MapReduce make a great toolkit for a large number of typical ETL-like solutions. All of these options scale to support data much larger than our example. Watch for part 2 of our article on ClojureScript used in Single Page Applications to see the results of our world cup analysis. Now back to categorizing my receipts.
Do you need an expert in business intelligence? With a team of BI specialists covering a wide range of skill sets and backgrounds, The BHW Group is prepared to help your company make the transformations needed to remain competitive in today’s high-tech marketplace.